


 Trash & Recycling
 Online Payments
 City Documents
 Parks
Parks
 Traffic Court
 E-NEWS
 EXPLORE
 NEWS
NEWS
BikePed Count
National Bicycle and Pedestrian Documentation Project
The National Bicycle and Pedestrian Documentation Project is around the corner. On Tuesday Sept. 12th 2023 and Saturday Sept. 16th 2023 volunteers will help determine how people on bikes and on foot are using our streets. If you are able, your participation in the count would be greatly appreciated. The Razorbacks game is at 6:30pm on Saturday the 16th (vs. BYU); no conflict!
Why Do Counts?
Promoting walking and biking is important to the City; it is the mission of BikePed Little Rock, a key goal for our Sustainability office ("Accessible Alternative Transportation"), and provides many important benefits to our community. These are the only usage data available when discussing demand and latent demand for bicycle and pedestrian facilities and the importance of bicycle and pedestrian accommodations to City staff, elected officials, the public, businesses and granting agencies. This BikePed count is the only way we have to see how we are doing overall and at specific locations over time.
How Are These Data Used?
It was by referencing these data that the City of Little Rock was able to successfully demonstrate to the Federal Lands Access Program that the Arkansas River Trail "Loop" is broken and their $1.6M funding was required to fix it (Fig. 1). These data also show that the bicycle is becoming a more important transportation mode in Little Rock (Fig. 2). These data will also be useful as we develop our new Master Street Plan to understand where bicycle and pedestrian facilities are most important.
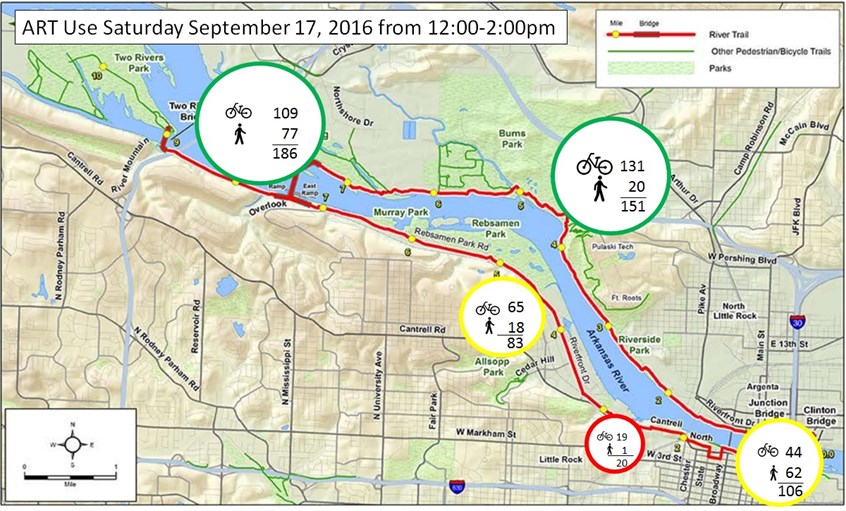
Figure 1. Demonstrating evidence of a problem (like the incomplete Arkansas River Trail Loop) is critical to getting grant funding.
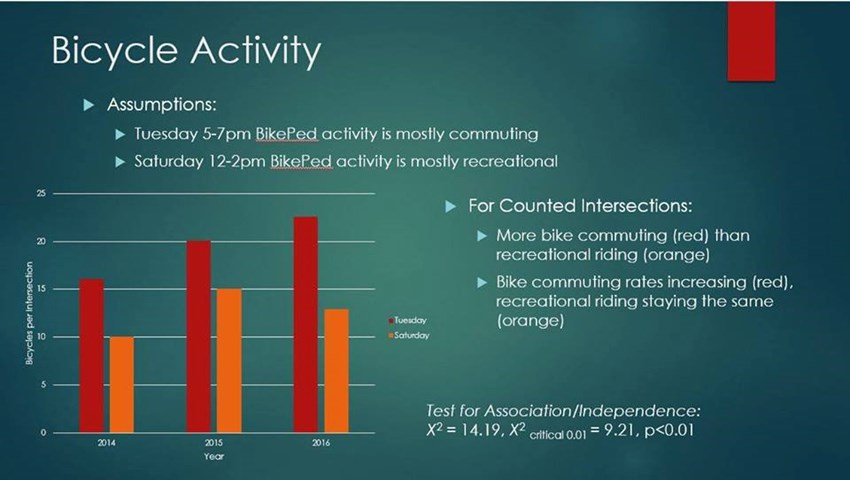
Figure 2. Evidence of ridership helps combat misconceptions about the importance of bicycle facilities in Little Rock.
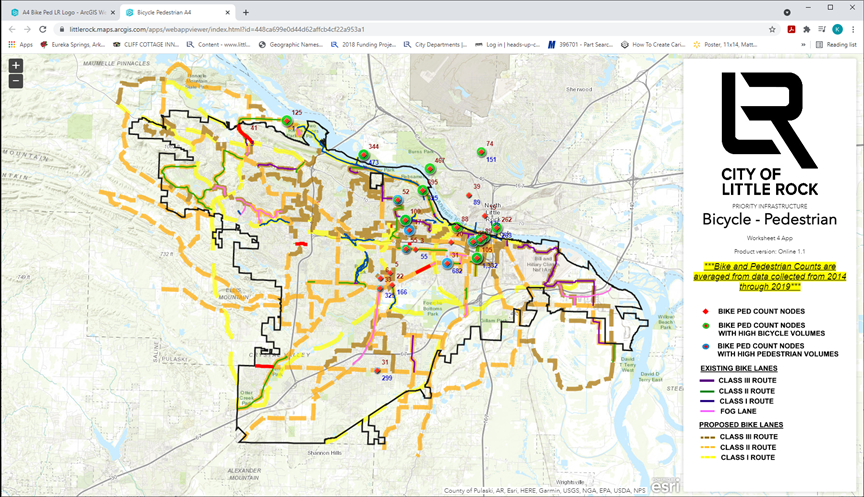
Figure 3. City of Little Rock bicycle and pedestrian count 2014-2019.
Other Sources of Little Rock's Bicycle and Pedestrian Use
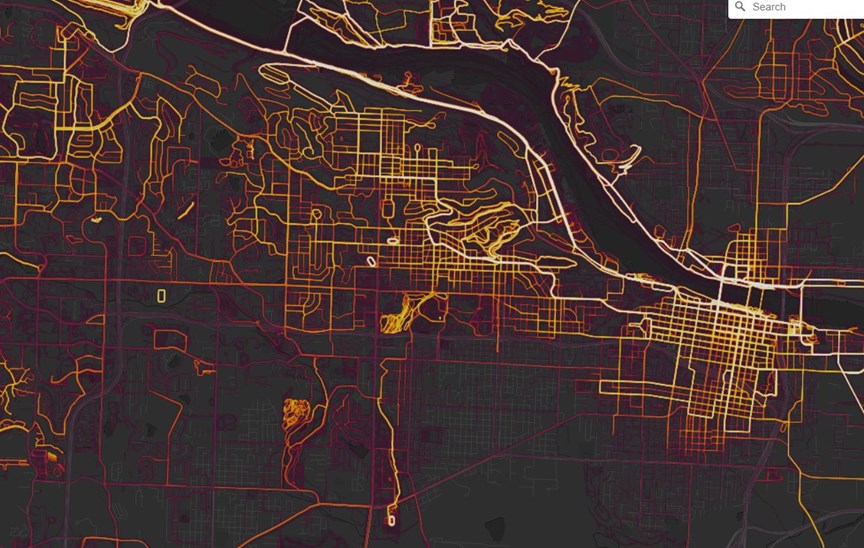
Figure 4. Routes Strava users for bicycle and pedestrian activity. Users can choose bicycle, pedestrian, or both on the map.
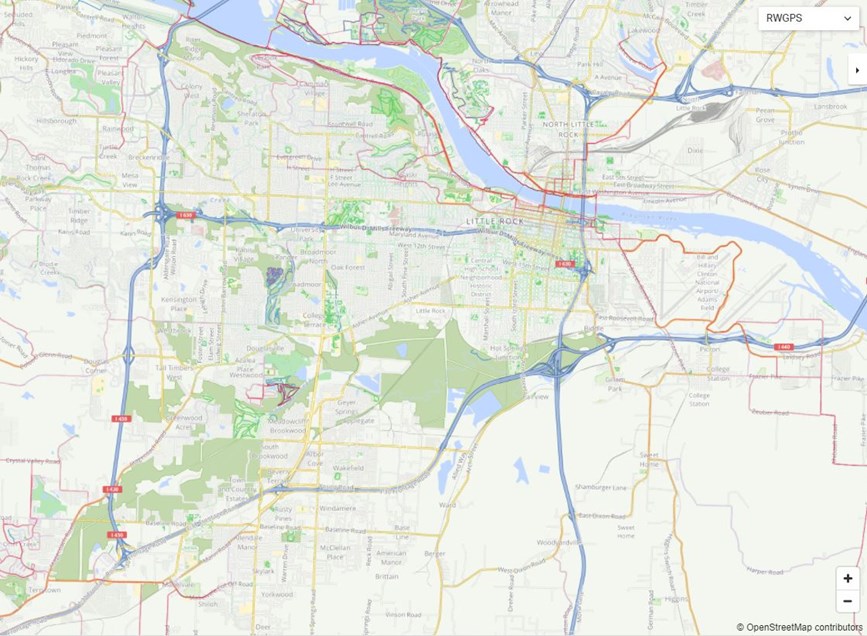
Figure 5. Ride with GPS users for bicycle and pedestrian activity. Users can choose bicycle, pedestrian, or both on the map.
Quantifying Safety
Metroplan puts together an informative publication considering bicycle and pedestrian crash frequency by location and demographic. One thing this report does is highlight the locations with the highest number of bicycle and pedestrians crashes (Fig. 6). But does this analysis mean that these corridors are inherently more dangerous for bicyclists and pedestrians, or simply that people walk and bike more frequently in these corridors? Without usage data (like the count data we will collect on Sept. 10th and 14th) it's impossible to know. As we gather better usage data, we can better interpret the patterns in crash data to understand where the more dangerous corridors are to walk and bike and respond accordingly.
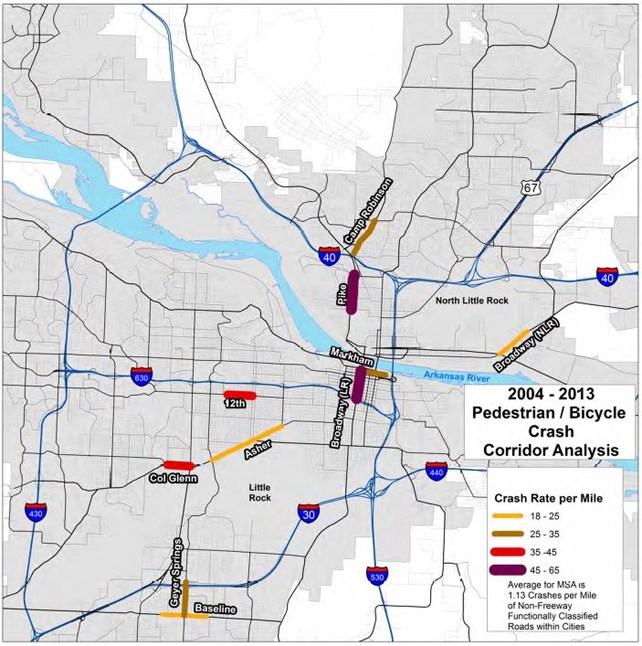
Figure 6. Corridors with the highest number of bicycle vs. car and pedestrian vs. car crashes (Figure 5 of Metroplan's Pedestrian/Bicyclist Crash Analysis 2015)
We Need Your Help!
Please consider volunteering two or four hours of your time to help gather the data necessary to inform the need for safer and more comfortable places to ride and walk, and see spatial patterns of bicycle and pedestrian activity.
Thank you!
For Volunteers
First of all, thank you!!! Volunteers can choose to either pick up materials in person or simply download and print the required documents. See below for more information.
Pick Up Materials in Person
I have all of the materials you need printed and ready to go at Public Works, 701 W. Markham St., 2nd Floor during business hours. Because instruction sheets are now specific to each count location, please let me know you want me to print your materials and make an appointment with me to pick them up (jlandosky@littlerock.gov) so that I have your materials prepared.
The building is now access-controlled, call me (371-4430) when you get here. If I'm not at my desk, call our office professional Sue Hulsey (371-4475). In addition to the Instruction Sheets and Count Sheet, if you physically pick up materials, I can also provide you a hi-vis vest and binder. Please return all materials to me as soon as possible (ideally within a week of the survey).
Print Materials on Your Own
For those who cannot or prefer not to pick up materials, the materials are linked below and in VolunteerMark. You can print these materials out, use them, and drop the finished counts off to me or scan and send them to me over email (jlandosky@littlerock.gov) preferably within a week of the survey.
Please review all of the materials prior to the day of the count so that I can answer any questions you may have.
Count Sheet
This is the sheet on which you will collect your count data. Please bring 1-2 count sheets with you for your count
Instruction Sheets
This year, the instruction sheets are specific to your location. Please print out the instruction sheet that matches your location:
