


 Trash & Recycling
 Online Payments
 City Documents
 Parks
Parks
 Traffic Court
 E-NEWS
 EXPLORE
 NEWS
NEWS
How Can We Increase BikePed Safety?
Answering this question fully is beyond the scope of what can be done on this page. The following list offers some direction, see also.
Education
Educating all road users about how to be better drivers, bicyclists, or pedestrians and how to better coexist with other transportation modes is important. The linked page contains some resources by topics, BikePed-specific traffic laws, and opportunities for formal classes.
More Bicycle and Pedestrian Facilities
On-street and off-street bicycle and pedestrian facilities separate vehicular traffic from bicycle and pedestrian traffic, increased perceived and real safety, and increase the number of walking and biking trips. Currently, less than half of our streets have sidewalks (Fig. 1) and only 2% of our arterial and major collector streets have bike lanes (as compared to 45% in an average LAB Silver-Certified city).
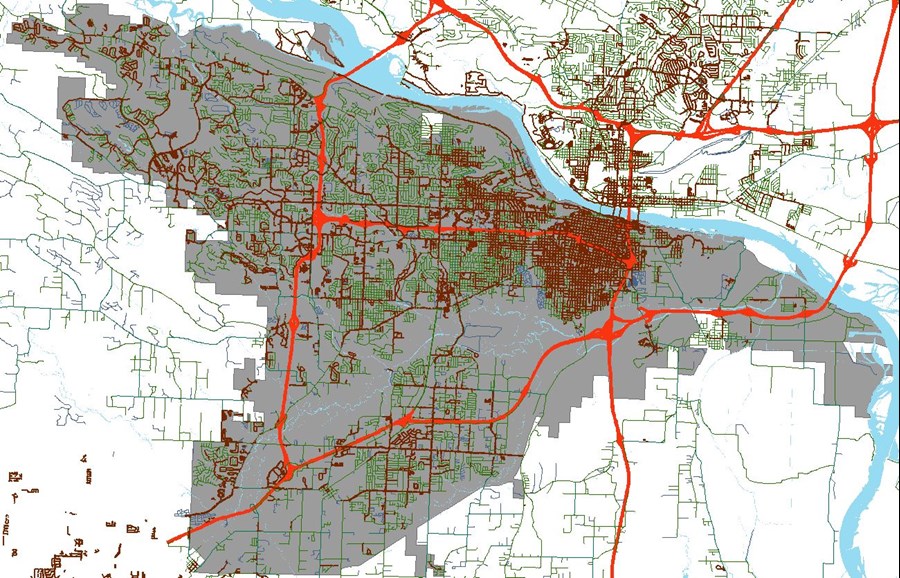
Figure 1. The City of Little Rock (shaded gray) including streets with sidewalks (brown lines) and streets without sidewalks (green lines).
Better Bicycle and Pedestrian Facilities
Some bicycle and pedestrian facilities are better than others, typically measured by the degree to which they separate vehicular traffic from bike and pedestrian traffic. For example, a sidewalk with a greenspace in between it and the road offers a buffer that increases perceived and actual safety as compared to a sidewalk immediately adjacent to a street (Fig. 2). Quality crosswalks are particularly important for pedestrians. Similarly for bikes, an off-street trail > protected bike lane/cycle track > buffered bike lane > conventional bike lane > sharrow. The perceived (and actual) safety of better bike facilities encourages much more ridership than poorer bike facilities (Fig. 3).
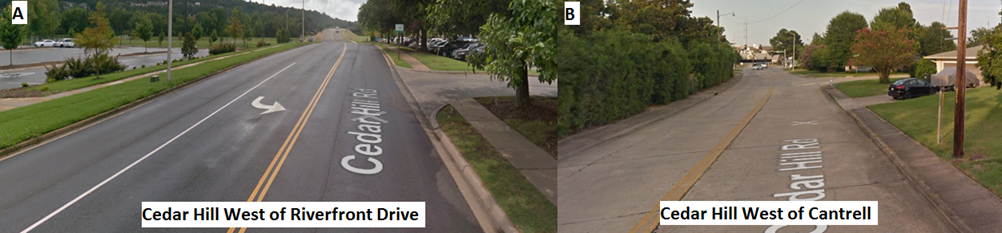
Figure 2. How safe would you feel on 5A left with a 11 ft. greenspace between the sidewalk and the curb vs. 5A right with a three foot greenspace vs. 5B with no greenspace? How likely would you be to use these facilities? How would you feel about your children using these facilities?
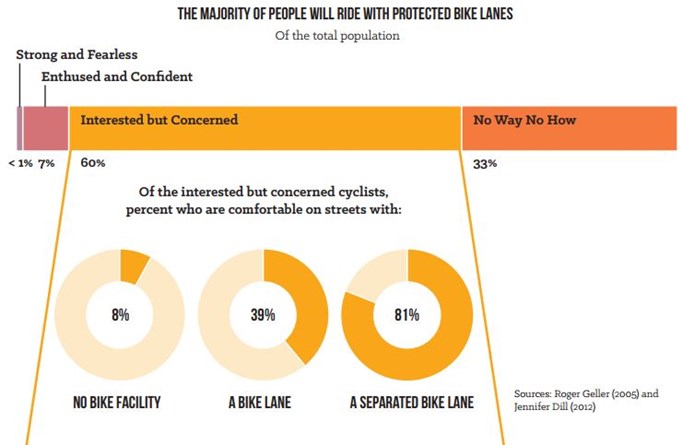
Figure 3. Not only the presence of bike facilities, but the quality of bike facilities has an effect on perceived safety and thereby a strong effect on ridership.
Complete Networks of Bicycle and Pedestrian Facilities
Have you ever heard the phrase "A chain is only as strong as its weakest link"? That's true for a pedestrian or bike route from an origin to a destination as well. Even if there is a beautiful eight foot wide, ADA-compliant, greenspace-separated sidewalk along most of the half mile between your home and your place of work, if that sidewalk ends and forces you to walk in the street for two blocks, you are much less likely to walk to work. The same goes for bike networks. Like many cities, we have opportunistically added bicycle and pedestrian facilities when possible, sometimes leaving us with sporadic, disconnected links. Resources exist to evaluate bicycle and pedestrian networks and to prioritize projects based on their improvement to the overall network.
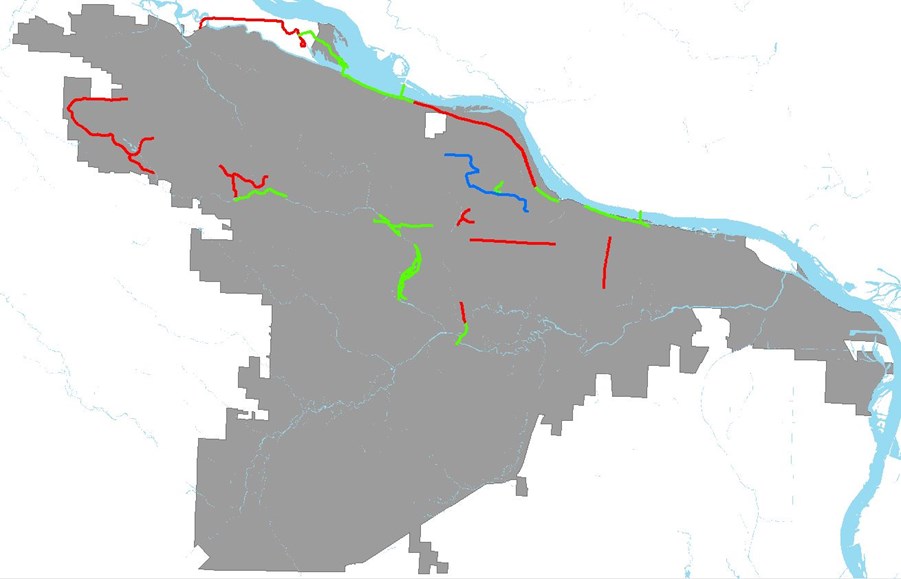
Figure 4. The City of Little Rock (shaded gray)'s installed off-street trails (green), bike lanes (red), and sharrows (blue).
Increase Ridership and Pedestrian Activity
We know that an increased perception of bicycle and pedestrian network safety can increase bicycle and pedestrian activity, but did you know that increased bicycle (and likely pedestrian) activity can increase per capita safety? It's true! The likely mechanism for this is how drivers' brains filter information, discussed more completely here. Essentially, when flooded with stimuli (as a driver is when driving at any speed), the brain tends to "throw out" information it doesn't expect. When bicyclists and pedestrians become a more normal part of traffic flows, they are more visible to drivers, and these modes are safer.
Reduce Speeds
Bicycle and pedestrian safety decreases with vehicular speeds. It narrows the width of the road observed by a driver, decreases reaction time, and dramatically increases the severity of collisions (Fig. 5).
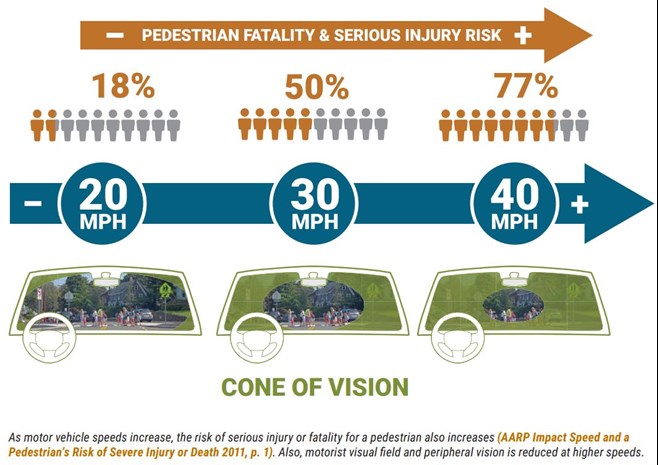
Figure 5. As driver speed increases, the driver looks through a narrower and narrower cone, which can disproportionately affect visibility of bicyclists and pedestrians, who tend to be on a street's periphery (US DOT/FHWA).
A variety of engineering techniques can be applied to slow traffic when necessary.
Establish Safe Speed Limits
US DOT recently updated a tool, USLIMITS2, to help traffic engineers establish safe speed limits for each roadway. This tool could be used to evaluate the speed limits on our streets, perhaps initially focusing on the most dangerous corridors for bicyclists and pedestrians (Table 2).
Reduce Speeds: Reduce Lane Widths
Reducing lane widths is one way to reduce vehicular speeds. An interstate lane width is 12 ft.; when a driver uses a road with 12 ft. wide lanes (or wider), it feels like he/she could be/should be traveling at interstate speeds. Narrowing lane widths has been shown to be an effective visual cue for drivers to reduce their speeds. Many of our 30-45 mph streets have 12 ft. wide lanes or wider.
Road Diets
A road diet is when lanes are reconfigured or narrowed to calm traffic (i.e. reduce speeds), create space for active transportation modes, and increase safety for all road users. Road diets reduce overall crash rates by 19-47% and also reduce crash severity (pgs. 5-10 and Appendix A). While not possible/appropriate in all situations, US DOT is encouraging them as a safety countermeasure, especially on four lane streets.
Uncontrolled Pedestrian Crossings
US DOT's current safety initiative for vulnerable road users is a comprehensive consideration of countermeasures for uncontrolled pedestrian crossings (i.e. crosswalks/intersections without a traffic light) called Safe Transportation for Every Pedestrian (STEP).
FHWA Proven Safety Countermeasures 2017
The Federal Highway Administration's list and description of 20 proven countermeasures, including Leading Pedestrian Intervals, Local Road Safety Plans, Medians and Pedestrian Crossing Islands in Urban and Suburban Areas, Pedestrian Hybrid Beacons, Road Diets, Road Safety Audits, Roundabouts, USLIMITS2, and Walkways.
Automated Speed/Red Light Enforcement
A recent literature review confirms that automated speed and red light enforcement increases bicycle and pedestrian safety, however Arkansas state law (pg. 17) does not permit automated enforcement. Arkansas is currently reviewing this policy.
Intimidation / Assault
Many people who regularly ride a bike have experienced a motorist intimidating them verbally, with a thrown object, or with the movements of their automobile. Driver road rage is understandably frightening for someone on a bicycle or walking with no protections against a collision. Some communities have passed legislation protecting vulnerable road users from intimidation. There have also been a few recent examples of alleged intentional assault in our community, including incidents in July 2017, October 2017, and another incident in October 2017. A central goal of our BikePed Friendly Driver Program (under development) will be to convey empathy for people using different modes of transportation on our streets, both for people in cars trying to safely get around bikes and pedestrians and for bicyclists trying to ride alongside a much faster, heavier, and more deadly transportation mode. More cyclists are electing to ride with a camera(s) to document incidents. Strong, protective laws, aggressive enforcement of those laws, and follow through by judges are all critical for the protection of vulnerable road users.
