
2024 BikePed Count
Once a year, in the second week of September, the City of Little Rock coordinates a bicycle and pedestrian count (Fig. 1). These data help us understand how bicycle and pedestrian recreation and transportation are distributed throughout Little Rock and how bicycle and pedestrian modes are changing over time, justifying infrastructure expenditures to City officials and providing data for grant applications. To gather these data, volunteers essentially sit or stand at a location, watch for bicycle and pedestrian traffic, and record the number of bicycles and pedestrians passing by.
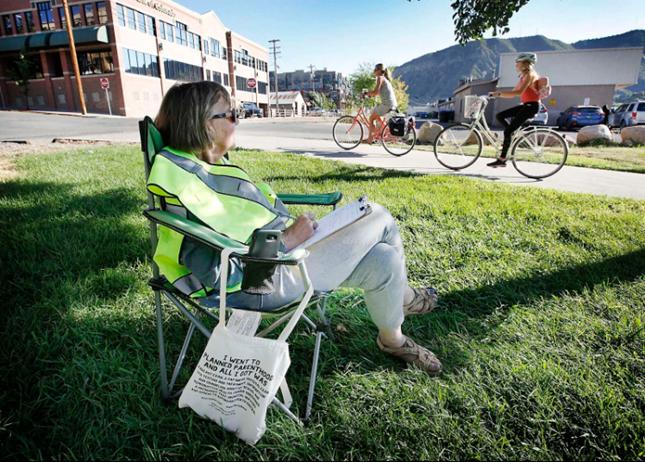
Figure 1. To get these valuable data, volunteers need simply count people walking and biking as they go by.
We Could Use Your Help!
Please consider volunteering two or four hours of your time. This year, the count falls on Tuesday Sept. 10th from 5-7pm and Saturday Sept. 14th from 12-2pm. The Razorbacks game is at 3:15pm (vs. UAB); no conflict! Volunteers can choose to either pick up materials in person or simply download and print the required documents. See below for more information.
Information for Volunteers
You Don’t Need a Partner
The volunteer signup sheet has enough room for two names per census location. That is to facilitate a volunteer sharing a location with another. Some people prefer to count with a partner. However, from the City perspective, there is no need to have a partner with you when you count. In fact the great majority of volunteers count their locations by themselves every year. If you want to make the most impact in the count, consider signing up for a location that does not yet have a volunteer so that we can get all of our locations covered.
Pick Up Materials in Person
I have all of the materials you need printed and ready to go at Public Works Administration, 701 W. Markham St., 2nd Floor during business hours. Because instruction sheets are now specific to each count location, please let me know you want me to print the materials specific to your count location and make an appointment with me to pick them up (jlandosky@littlerock.gov) so that I have your materials prepared.
The Public Work Administration building is now access-controlled, call me (501-371-4430) on your cell phone or from the Foyer phone when you get here. If I’m not at my desk, call our office professional Sue Hulsey (371-4475). In addition to the Instruction Sheets and Count Sheet, if you physically pick up materials, I can also provide you a hi-vis vest and binder; you may find these materials useful but they are not required. Please return all materials to me as soon as possible (ideally within a week of the survey).
Print Materials on Your Own
For those who cannot or prefer not to pick up materials, the materials are linked below and in VolunteerMark. You can print these materials out, use them, and drop the finished counts off to me or scan and send them to me over email (jlandosky@littlerock.gov) preferably within a week of the survey.
Please review all of the materials prior to the day of the count so that I can answer any questions you may have.
Count Sheet
This is the sheet on which you will collect your count data. Please bring 1-2 count sheets with you for your count. Note: The Monroe and 6th location has a different count sheet found on that location’s instruction sheet.
Instruction Sheets
This year, the instruction sheets are specific to your location. Please print out the instruction sheet that matches your location:
More Information About Little Rock’s BikePed Count
The rest of this webpage (from this point down) simply gives background information about the importance of these data and what they’re used for (calling all advocates and data nerds). TLDR? No problem! There’s no need to read on to be an effective volunteer. This is just for your information.
What are you trying to learn?
Change Over Time: Promoting walking and biking is important to the City; it is the mission of BikePed Little Rock, a key goal for our Sustainability office (“Accessible Alternative Transportation”), and provides many important benefits to our community. Given the importance of increasing bicycle and pedestrian activity, we need some measure of how this activity is changing over time to quantify the success of our efforts to increase these travel modes. These data help track that. The U.S. Census Bureau also tracks bicycle and pedestrian activity over time through their American Community Survey (ACS, Fig. 2).
Why is our BikePed count an important compliment to the ACS data? The ACS asks a specific question: “How did this person get usually get to work last week?” This specificity is presumably to get around the bias of how someone identifies (i.e. I am a bike commuter!) with their actual behavior. However, phrased this way, the question also has some drawbacks. One of the biggest ones is that it considers only the person’s work commute. Some Little Rock residents live too far away from work, or the commute is perceived as too unsafe, to regularly walk or bike to work, but that doesn’t necessarily mean that they don’t walk or bike commute within their neighborhoods. It also does not track walking or biking for recreation at all. Our BikePed count captures all walking and biking activity, albeit at limited points and times.
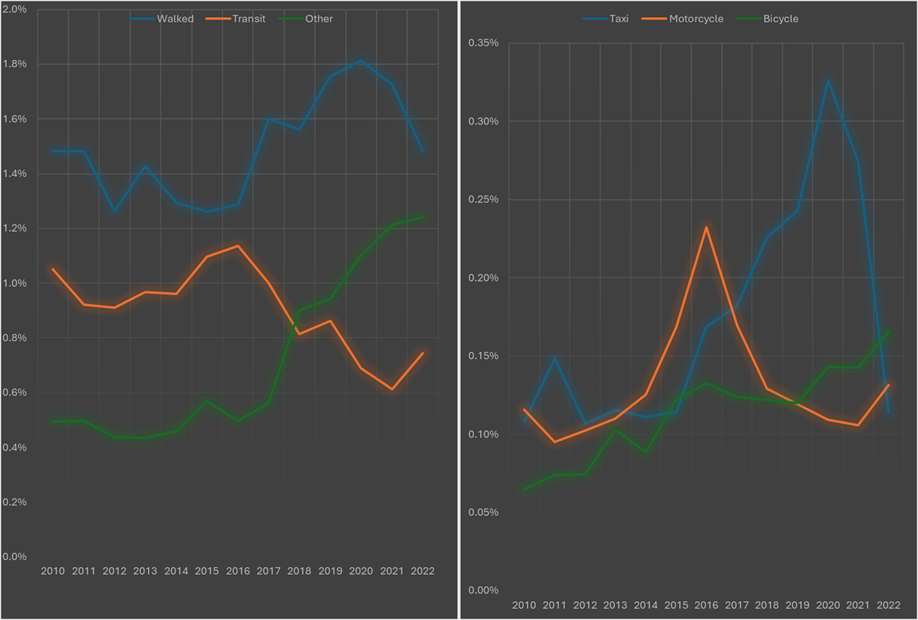
Figure 2. The U.S. American Community Survey’s annual bicycle and pedestrian estimate shows that Little Rock’s walking activity has fluctuated over 12 years, but shows no overall pattern of increasing or decreasing. Bicycle activity, on the other hand, has more than doubled over those 12 years. Note that the only other mode that clearly increased is “Other”. This mode sharply increased in 2018, the same year our shared scooter programs were introduced. Scooters also benefit from bike infrastructure.
Recreation vs. Transportation: It’s also important to know why people are walking and biking (i.e. transportation vs. recreation). This helps us prioritize the types and locations of bicycle and pedestrian infrastructure. While volunteer counters don’t interview people walking and biking, count data can be suggestive of purpose. People do not generally ride on urban streets for recreation; there are too many stop signs, red lights, and cars to make the trip recreational. Therefore, on-street counts are typically for transportation. Moreover, Tuesday after work activity may be more likely to be transportation than recreation.
Corridor Choice: When we plan our bicycle and pedestrian networks, it’s useful to know where people are walking and biking with the current infrastructure, as one component of demand for sidewalks and bike infrastructure on that street. Of course some streets that may have high demand for walking or biking activity may be stressful to navigate walking and biking with current infrastructure; in the same way you can’t determine the demand for a bridge by how many people are swimming across a river, we can’t always tell the need for BikePed facilities on a street based on how many people are using the street as it is. However, when we couple these data with surrogates for user stress (e.g. number of travel lanes and number of vehicles per day), we can get a measure for BikePed facility demand.
Here too there are other sources of these data. Strava, Ride with GPS, and other similar programs can track walking and biking activity when the app is downloaded to a smartphone and turned on for a specific activity. These aggregated data are freely available and can give an idea of which corridors are most heavily used for walking and biking (Strava can toggle between these activities and report data for walking, biking, or combined activities, Figs. 3-4). These heatmaps can be a great way to visually compare different corridors within a small area of Little Rock, but they too have significant disadvantages.
Strava’s Recreation Bias: First, these data have a bias for recreational pedestrian and biking activities (their toggle menu even says “All Cycle Sports” and “All Foot Sports” (Fig. 3). This is not a shortcoming of the Strava data, it simply reflects how the app is intended to be used. It is rare that someone walking or biking for transportation will use these apps; they’re more for tracking speed and frequency of workouts.
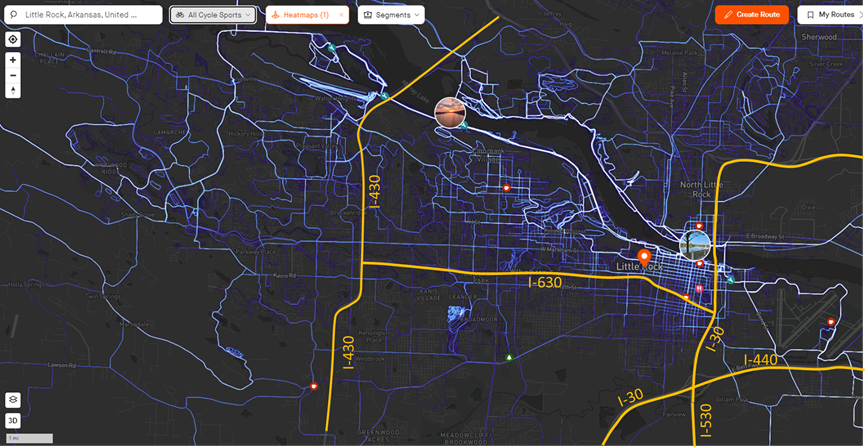
Figure 3A. Strava heatmap of all bicycling activities (orange highways added for spatial clarity).
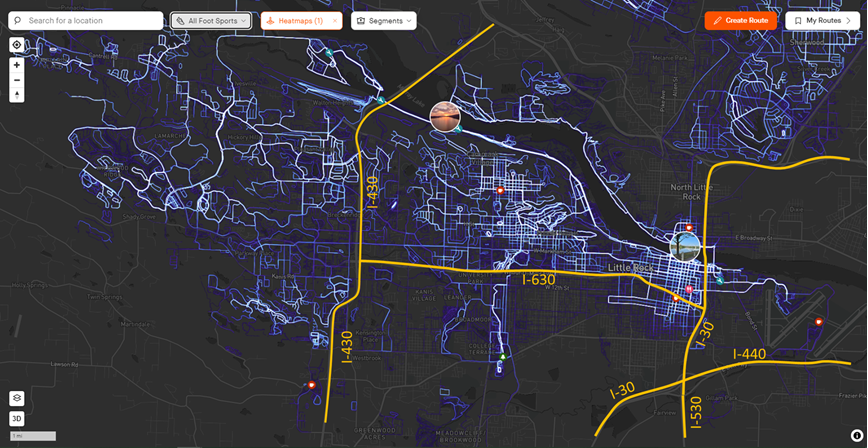
Figure 3B. Strava heatmap of all pedestrian activities (orange highways added for spatial clarity).
Figure 4. Ride with GPS users for bicycle and pedestrian activity. Users can choose bicycle, pedestrian, or both on the map.
Strava’s Equity Bias: Second, they have a significant equity bias. When someone says “cyclist”, we might have a mental image of a Caucasian male with an expensive bicycle (Middle Aged Men in Lycra, MAMIL). It is important work to disabuse City staff and elected officials about this impression as it applies to bicycle activity on Little Rock streets, HOWEVER that impression may describe the average Strava or Ride with GPS app user. If so, that means that these apps are not adequately tracking the bike commuter population as a whole. Strava and Ride with GPS data can actually be used to demonstrate this bias.
The Strava heatmap (Fig. 3) clearly shows higher activity west of I-30, north of I-630, and west of I-430 (Fig 3). This pattern follows closely other demographic patterns (Figs. 5-6). The same areas with high Strava activity are areas of relative affluence and privilege while dim Strava areas are Low-Income, Disadvantaged Communities (LIDAC) of Little Rock (Figs. 5-6). Therefore, using the Strava data and the Figures 4-5 demographic data alone, we might conclude that poor people, people of color, and people south of I-630 and east of I-30 walk and bike less than more affluent people, white people, and people north of I-630 and west of I-430. This is a misconception of many Little Rock residents and decision-makers that would be supported if we only had these data.
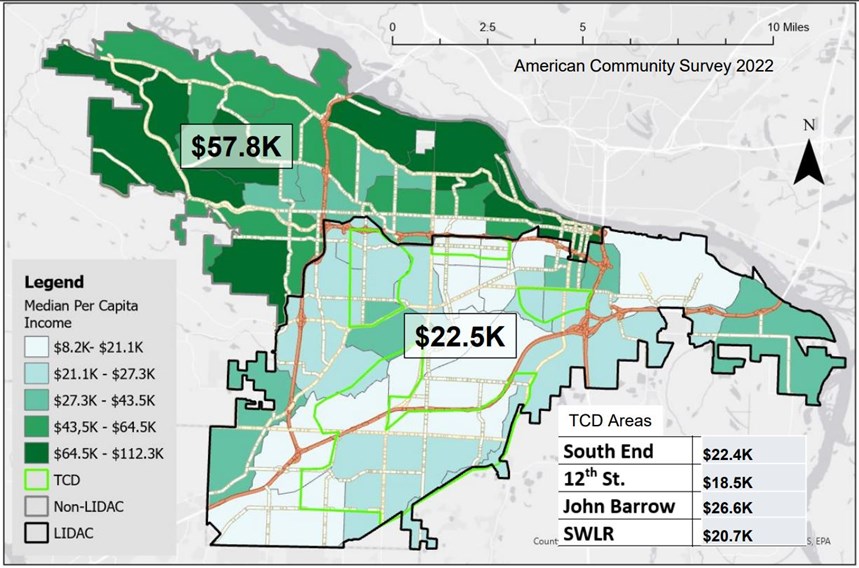
Figure 5. Map of Little Rock census tracts showing the spatial distribution of median per capita income (Quarm Pedestrian Equity Report, 2024).
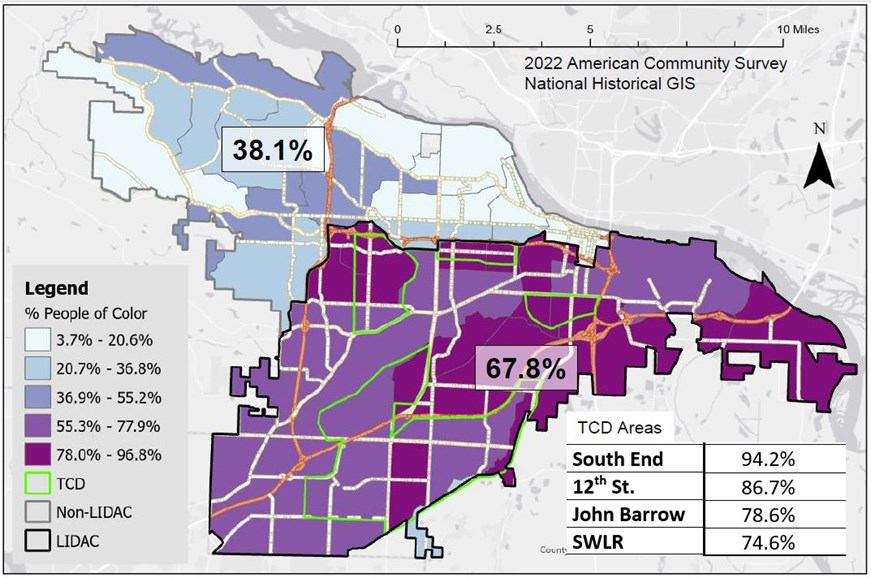
Figure 6. Map of Little Rock census tracts showing the spatial distribution of people of color (non-white, Quarm Pedestrian Equity Report, 2024).
LIDAC Little Rock households are almost three times more likely to not own a vehicle (Fig. 7). As a result, we know that LIDAC Little Rock residents are four times more likely to bike to work and nine times more likely to take transit to work (requiring walking or biking, Figs. 8-9). A lack of infrastructure and a fear of being hit by a car are major disincentives to walk and bike for transportation in Little Rock, and as a result, people tend not to choose to walk or bike for transportation and walking and biking rates are low in our city (Tables 1-2). However, our Black and low-income residents are more likely to need to walk or bike for transportation in a transportation network primarily built to support fast, efficient vehicular movement, disproportionately loading the high risk of walking and biking in Little Rock onto these groups (Fig. 7, Tables 3-4). As a result, Black Little Rock residents are three times more likely to be hit by a car while walking or biking vs. white residents (Fig. 10).
Strava heatmaps provide useful information (the relatively more used corridors in small subsections of Little Rock) but also grossly misleading information if not properly understood. BikePed count data can help to quantify and temper the biases of the Strava data.
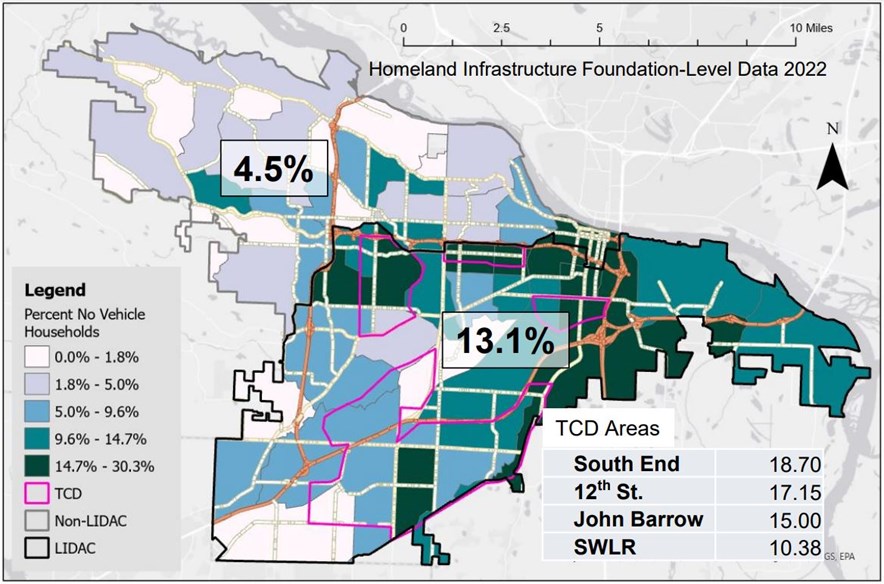
Figure 7. Map of Little Rock census tracts showing the spatial distribution of zero-car households (Quarm Pedestrian Equity Report, 2024).
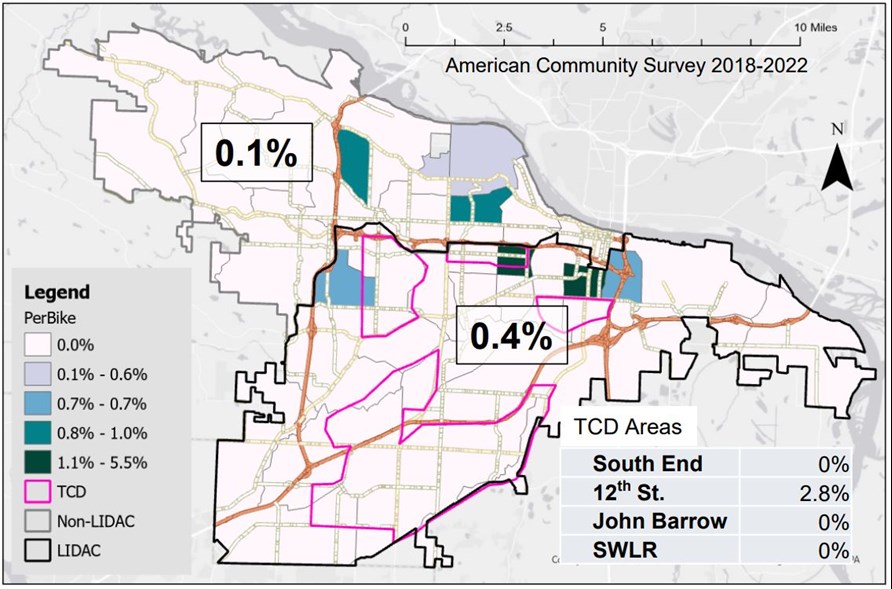
Figure 8. Map of Little Rock census tracts showing the spatial distribution of Little Rock residents who bike to work (Quarm Pedestrian Equity Report, 2024).
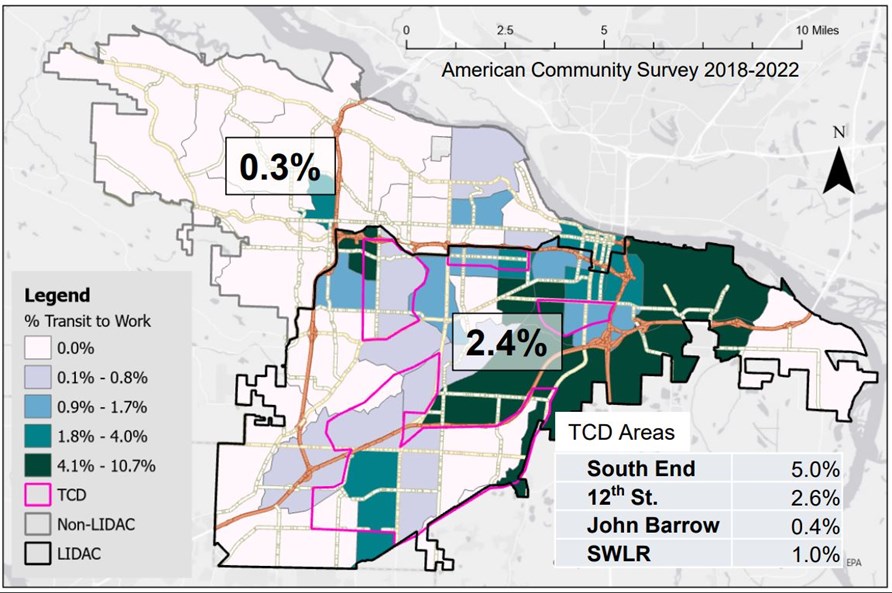
Figure 9. Map of Little Rock census tracts showing the spatial distribution of Little Rock residents who take the bus to work (Quarm Pedestrian Equity Report, 2024).
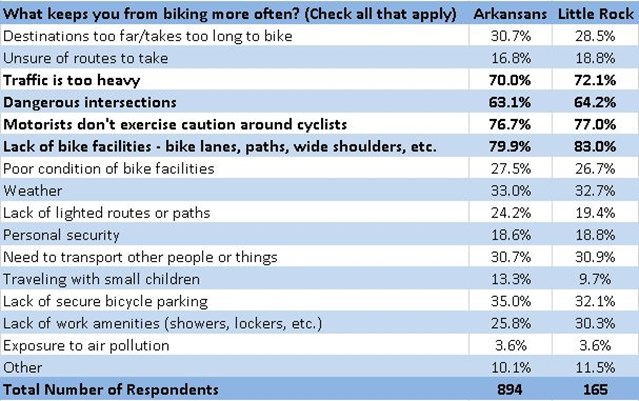
Table 1. A lack of bike facilities and a fear of being run over by a car are the primary disincentives to biking in Little Rock, contributing to low rates of ridership (Data from ARDOT’s Arkansas Bicycle and Pedestrian Transportation Plan, 2017).
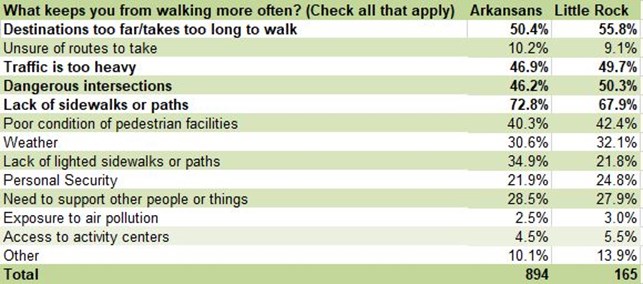
Table 2. A built environment organized around cars (destinations take too far to walk and lack of sidewalks/paths) and a fear of being hit by a car are the primary disincentives to walking in Little Rock, contributing to low rates of ridership (Data from ARDOT’s Arkansas Bicycle and Pedestrian Transportation Plan, 2017).
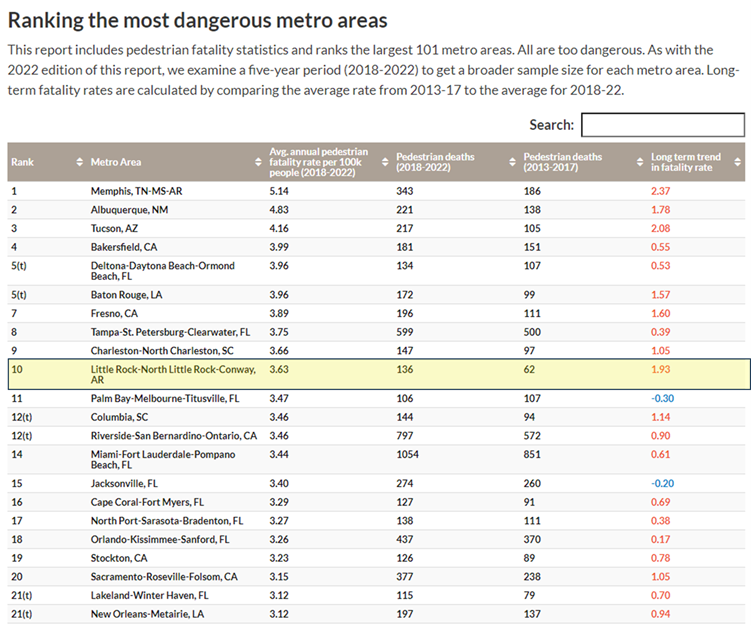
Table 3. Smart Growth America’s Dangerous by Design (2024) shows that Little Rock is the 10th most dangerous place to walk in the country.
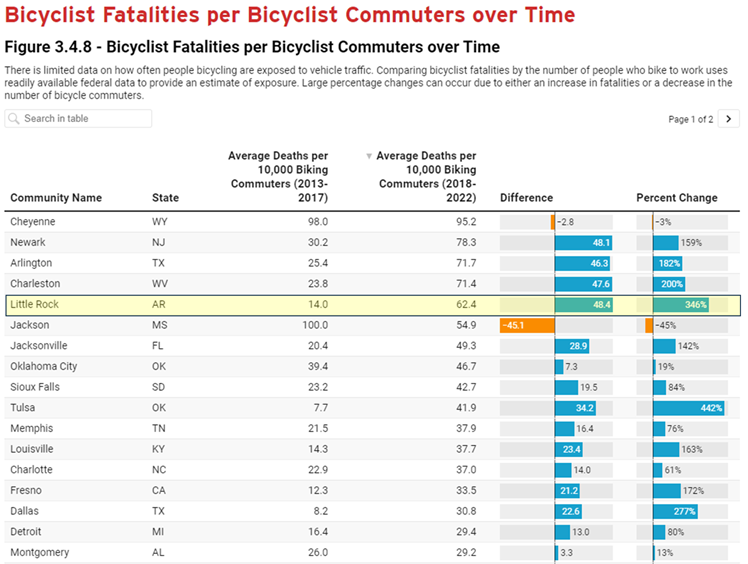
Table 3. The latest League of American Bicyclists’ benchmarking report shows that Little Rock is the 5th most dangerous place to bike commute in the country.
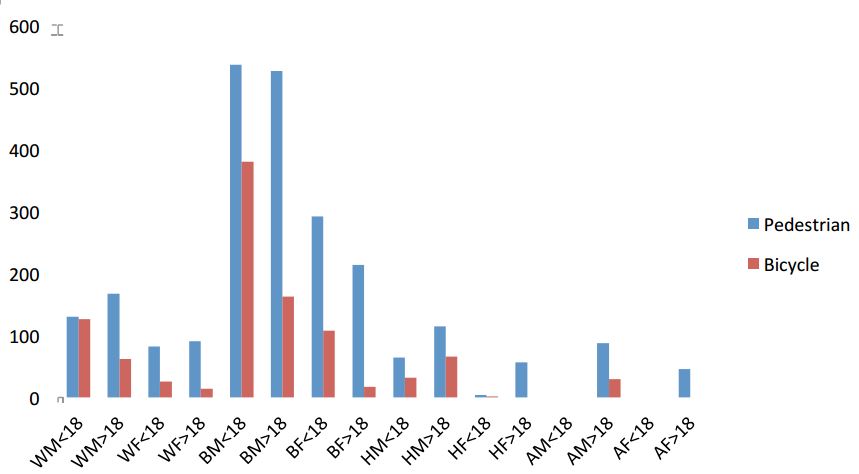
Figure 10. The number of pedestrian and bicycle crashes per 100,000 residents of each demographic in the Little Rock metro area from 2004-2013 (WM=white male, WF=white female, BM=black male, BF=black female, HM=Hispanic male, HF=Hispanic female, AM=Asian male, AF=Asian female). This is Figure 8 of Metroplan’s Pedestrian/Bicyclist Crash Analysis 2015.
Yet another limitation of the Strava data for the purposes of our BikePed count is that it’s not quantitative (at least in a way that is available to the City of Little Rock for analysis). It’s a good visual reference, but it’s impossible to compare corridors of similar use or run statistics.
Shared Scooter Tracking: Another way to learn more about what corridors are preferred for bike commuters specifically are the collected data from our e-scooter share companies. Shared scooters are neither bikes nor pedestrians, but they share a lot of the same capabilities and challenges of bikes. Knowing what corridors scooters are using vs. the traffic stress of a street helps us understand where bike infrastructure is needed the most. Our scooter companies are able to provide these data to the City. A limitation of these data is that the scooter share programs are primarily located in the greater downtown area and are therefore most useful in that subsection of Little Rock
Equity and the BikePed Count: You would be forgiven for thinking that all of this sounds somewhat esoteric, but it’s not. The City of Little Rock is a data-driven municipality. The prevailing understanding is that walking and especially biking are hobbies of our relatively affluent residents. This false understanding has consequences. It drives where we install pedestrian and bicycle infrastructure (Figs. 11-12), but also the urgency of installing this infrastructure at all. Equity is a core value of the City of Little Rock (Fig. 13). Our transportation network does not create equal transportation risk between races (Fig. 10), regions (Fig. 14), or corridors (Fig. 15) and therefore needs to be addressed to be in-line with the City’s core values. The City has started to do that with our Targeted Community Development program and our equity-driven $25M Safe Streets for All application. Continued data acquisition will allow the City to better understand how people are walking and biking on our street network to best allocate limited resources.
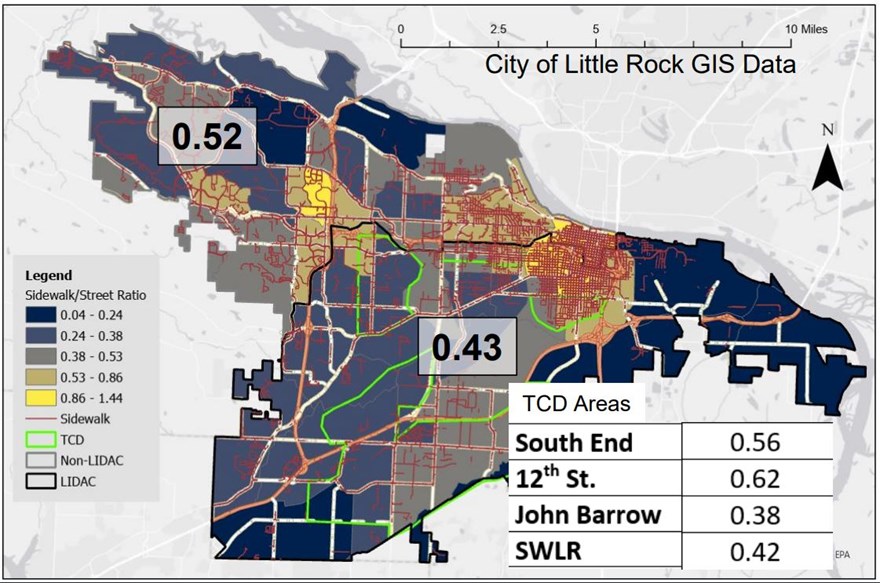
Figure 11. Little Rock has fewer sidewalks in LIDAC vs. non-LIDAC Little Rock (Quarm Pedestrian Equity Report, 2024).
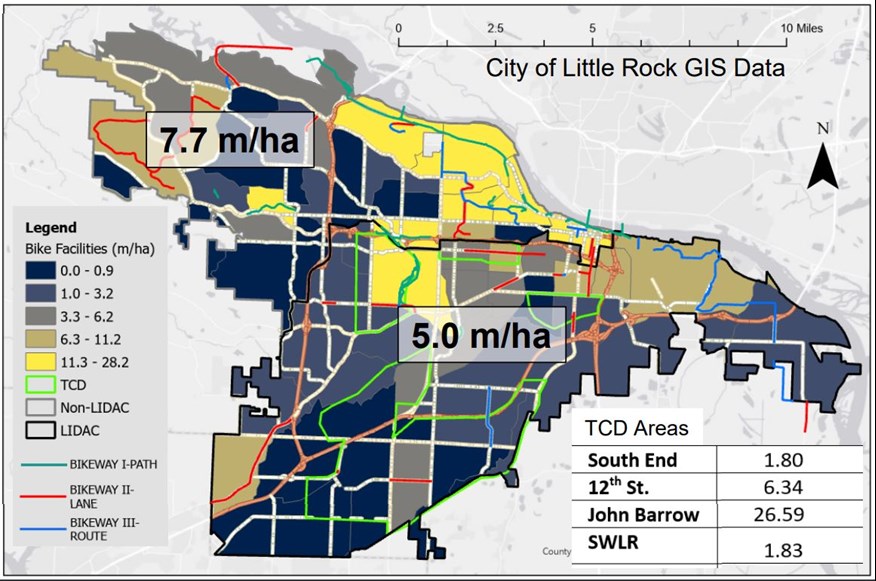
Figure 12. Little Rock has fewer bike facilities in LIDAC vs. non-LIDAC Little Rock (Quarm Pedestrian Equity Report, 2024).
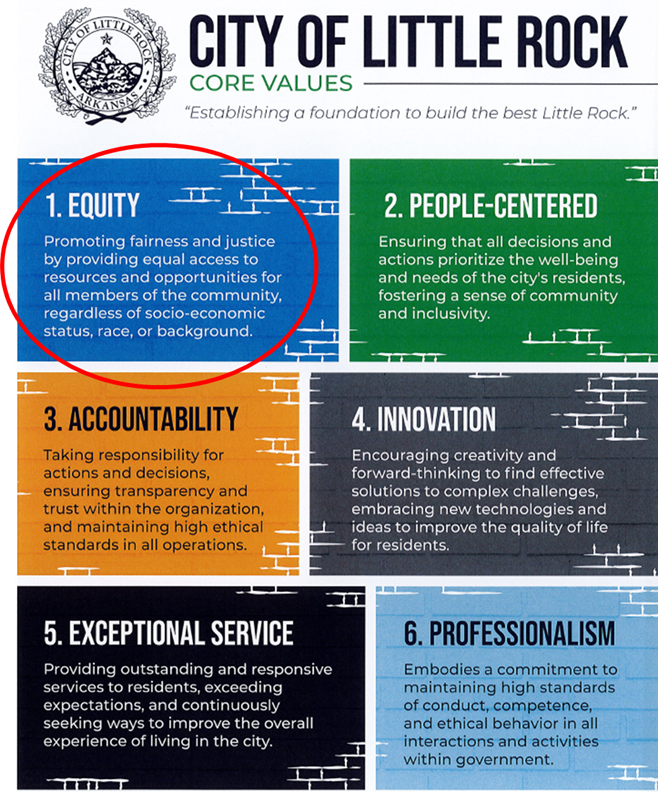
Figure 13. Equity is a core City of Little Rock value. It is the responsibility of City staff members to make connections between their subject expertise and these core values. Safe and convenient pedestrian and bike networks throughout Little Rock, but especially within LIDAC Little Rock, promotes Equity.
The Future of BikePed Counts
Traffic Camera Counters: There is no substitute for in-person BikePed counts in Little Rock… at least not yet. Newer traffic cameras (i.e. the ones on traffic lights that help determine the length of a red light based on vehicular cue), including some of the newer traffic cameras already installed in Little Rock, have the hardware capability of counting people walking and biking with the addition of AI software (Fig. 14). This would give us the capability of counting people walking and biking in MORE locations 24 hours a day, 365 days a year. The disadvantage would be that these camera locations might not be where we would choose to put them for the purposes of doing a BikePed count; we would still need to do some off-street counts and some annual counts at camera locations to validate data, but the burden on the volunteer community would be far less if the City of Little Rock were to install this inexpensive software.
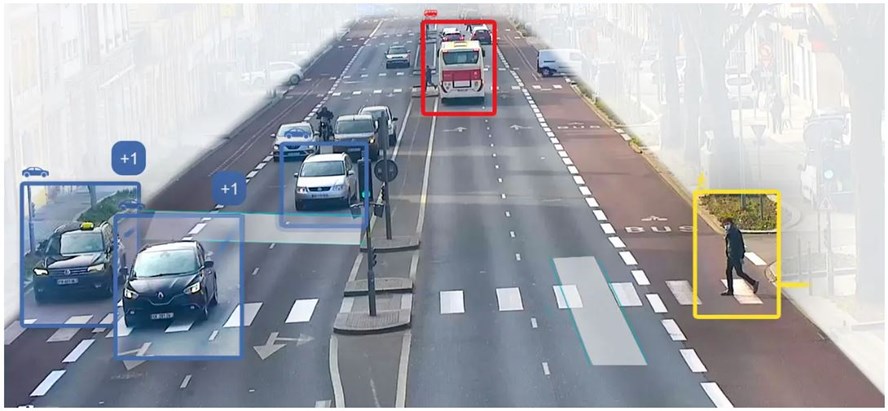
Figure 14. AI technology can be coupled with existing traffic cameras to do BikePed counts.
Smartphone Tracking Software: Another promising development is the coming of age of geolocation via smartphone tracking software. Companies like Streetlight consider the speed at which your phone is moving and assume the transportation mode used (in this way, as I understand it, scooters may be grouped with bicycles). As I understand it, these data do not require smartphone owners to download an app or buy in in any way; smartphone companies simply aggregate and provide these historic data. A major advantage to this type of dataset is that it will have fewer biases (while it does require a smartphone, biasing against low-income and young residents, it is not a fitness app that must be downloaded and activated). Another major advantage is that it tracks mode-specific movement on every street and off-street trail in the City of Little Rock all-day, everyday. The major disadvantages are the delay and the cost. Streetlight data are currently only available with an approximate two-year delay and the cost may be prohibitive for the City.
Data Collection Technique Conclusions
None of these data collection techniques are perfect. They each have their benefits and drawbacks. Each offers a limited window into bicycle and pedestrian activity in Little Rock. However, the greater the number and diversity of data collection techniques we have, the more accurate a picture we’ll have of how people are currently moving in Little Rock by bike, scooter, and foot, and how people want to move on our transportation network with infrastructure improvements. The above has not discussed how these data sources could be integrated to form a more complete story. The ideal would be to bring online an automated counting system, such as traffic cameras and/or even better, smartphone tracking software, then use the volunteer BikePed counts not as our primary window into corridor-specific BikePed behavior, but to calibrate and validate automatic counting mechanisms, to have a 24-hour/day, 365-day/year assessment of our entire transportation network without increasing the burden on volunteers. Note that several existing count locations do not have traffic lights and therefore certainly do not have traffic cameras. To the extent that those point locations are important to the dataset, those will still have to be volunteer counted (unless the City purchases the smartphone tracking data).
How Are These Data Used?
It was by referencing these data that the City of Little Rock was able to successfully demonstrate to the Federal Lands Access Program that the Arkansas River Trail “Loop” is broken and their $1.6M funding was required to fix it (Fig. 15). These data also show that the bicycle is becoming a more important transportation mode in Little Rock (Fig. 16). These data will also be useful as we develop our new Master Transportation Plan to understand where bicycle and pedestrian facilities are most important.
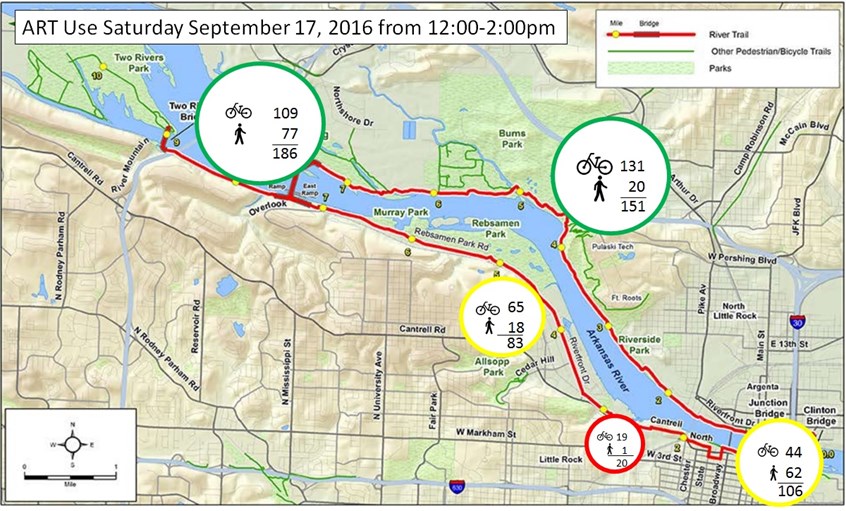
Figure 15. Demonstrating evidence of a problem (like the incomplete Arkansas River Trail Loop) is critical to getting grant funding.
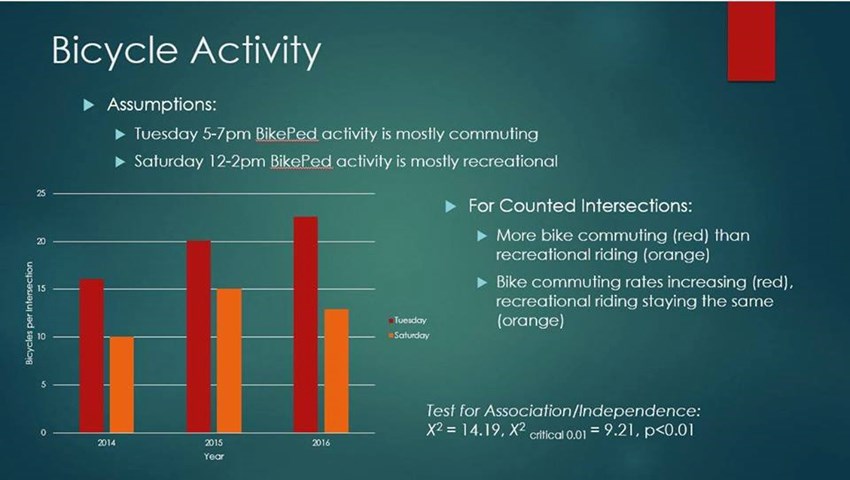
Figure 16. Evidence of ridership helps combat misconceptions about the importance of bicycle facilities in Little Rock.
Figure 17. City of Little Rock bicycle and pedestrian count 2014-2019.
Metroplan puts together an informative publication considering bicycle and pedestrian crash frequency by location and demographic. One thing this report does is highlight the locations with the highest number of bicycle and pedestrians crashes (Fig. 18). But does this analysis mean that these corridors are inherently more dangerous for bicyclists and pedestrians, or simply that people walk and bike more frequently in these corridors? Without usage data (like the count data we will collect on Sept. 10th and 14th) it’s impossible to know. As we gather better usage data, we can better interpret the patterns in crash data to understand where the more dangerous corridors are to walk and bike and respond accordingly.
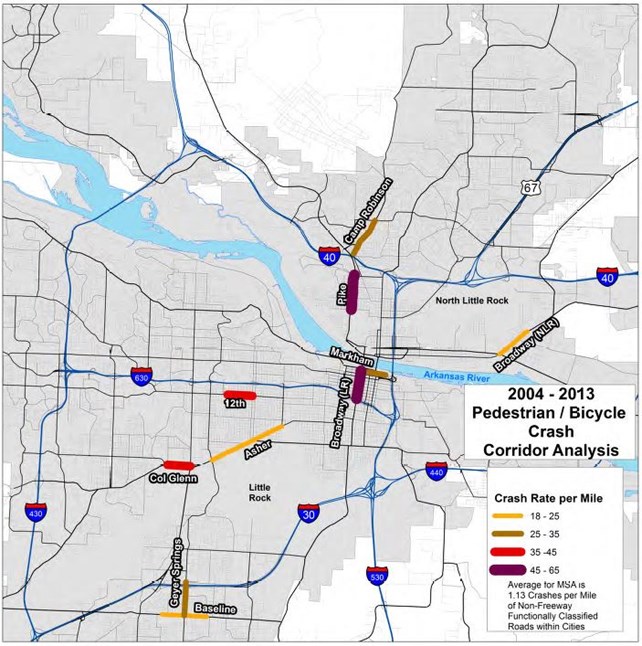
Figure 18. Corridors with the highest number of bicycle vs. car and pedestrian vs. car crashes (Figure 5 of Metroplan’s Pedestrian/Bicyclist Crash Analysis 2015). Notice how our count locations consider these corridors.
Location Selection
Every year, we evaluate the utility of every BikePed count location to make sure we are collecting the most relevant data for assessing the City of Little Rock as a whole over time, but also to gauge the impact of upcoming projects. For the first goal, it is important to retain legacy sites to keep track of patterns over time and to calibrate counts for new locations. For this reason, we need to be very careful to not remove too many legacy sites from the BikePed Count too quickly. For the second goal, we consider new information and upcoming projects to determine where we need to better understand bicycle and pedestrian activity. These locations may be counted for 2-3 years, as they’re relevant to a specific project.
Equity of BikePed Count Locations: A 2024 equity analysis of BikePed use and safety in Little Rock underscores the need to improve bicycle and pedestrian conditions of LIDAC Little Rock. To understand impacts of future interventions, we need to better understand BikePed use in LIDAC Little Rock. Our goal will be to keep the same or increase the ratio of LIDAC Little Rock vs. non-LIDAC Little Rock count locations. Just counting locations within the City of Little Rock, in 2023 we had eight LIDAC Little Rock locations and 14 non-LIDAC Little Rock locations, for a ratio of 0.57. In 2024, we will have 12 locations in LIDAC Little Rock and 14 non-LIDAC Little Rock locations, for a ratio of 0.86.
The Rise of Pettaway: Pettaway’s new development has given the neighborhood new vibrancy and activity. Ideally, we would have started this count location years ago, before those changes happened. However, even more development is expected. You might notice that there is another count location at 17th and Johnson. That count location was added to consider the baseline walking and biking before a pop-up was installed in December 2023. That pop-up recently resulted in a four-way stop at 17th and Commerce. We will count at 17th and Commerce this year and next year to determine the effects of changes at that intersection to bicycle and pedestrian activity. Even though these locations are only a few blocks apart, they are measuring different things. Commerce and 17th is measuring the effects of a corridor safety improvements on BikePed traffic while Commerce and 21st is considering the effects of small-scale development on BikePed activity. We added Commerce and 21st in 2024.
Arkansas Vulnerable Road User Safety Assessment: Last year, ARDOT released an assessment of the most dangerous corridors in Arkansas for people walking and biking within the Arkansas Vulnerable Road User Safety Assessment. The most dangerous state-owned and City managed corridors were in Little Rock (Fig. 19, Table 1). We want to make sure that we have at least one BikePed count for each of these corridors so we can better understand risk in these areas (by just considering the number of bicycle and pedestrian crashes per mile, as the report does, there’s no way to disentangle greater BikePed usage vs. greater BikePed risk per pedestrian or per bike commuter).
Main Street: This portion of Main Street is covered by the legacy sites of both 3rd and Main and Daisy Bates and Main. No change.
Cumberland: LaHarpe and Markham is a legacy site. This intersection is where LaHarpe becomes Cumberland. No change.
Baseline: Baseline and Geyer Springs is a legacy site. We added Baseline and Chicot in 2024.
Asher: Asher and University and Asher and Fair Park are legacy sites. No change.
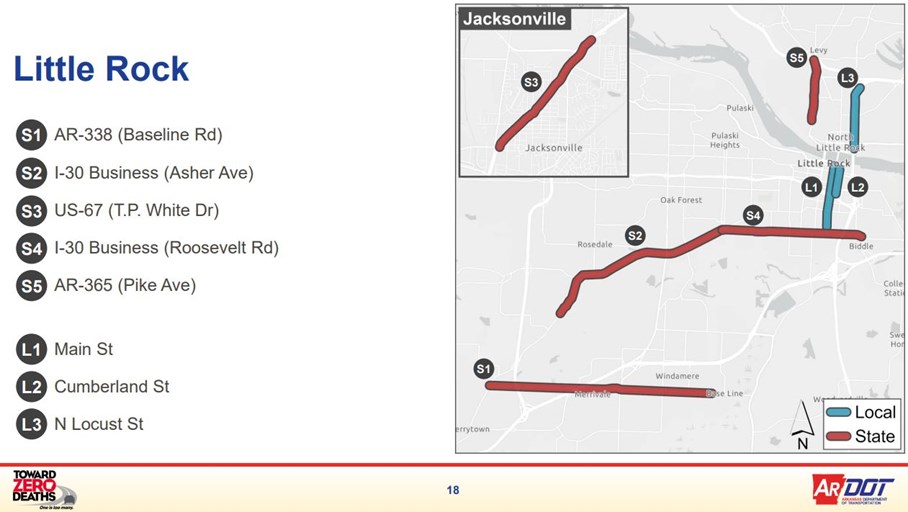
Figure 19. The most dangerous ARDOT-managed (red lines, “S”) and locally managed (blue lines, “L”) in Central Arkansas.
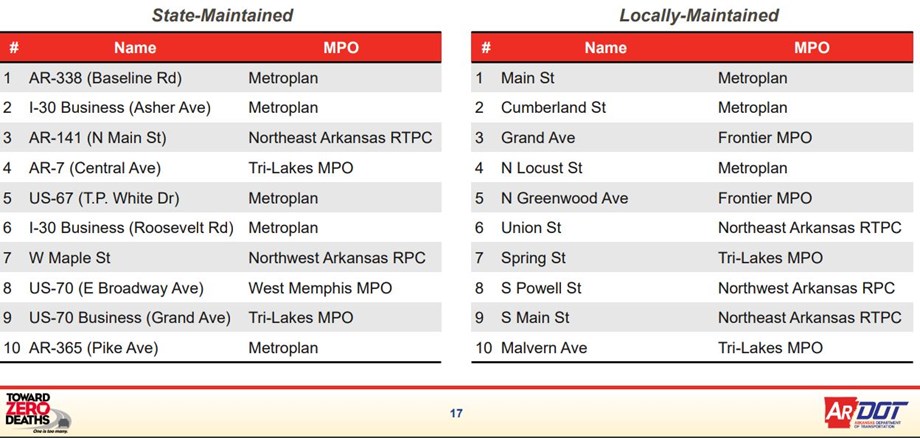
Table 1. Central Arkansas has the two most dangerous state-owned and two most dangerous locally-owned (City of Little Rock) corridors in the entire state.
Effect of Neighborhood Greenway: How much does a signed bike network/Neighborhood Greenway affect ridership? The Complete Streets: Bicycle Plan calls for Neighborhood Greenways on both 13th Street (to avoid the heavy traffic of 12th Street, even with bike lanes) and Johnson. They’re not there yet but they will be soon. This count will get a baseline for ridership that we can use to better understand how the signed network affects usage. It will also give us a rare glimpse into BikePed activity at a typical Residential/Residential intersection. We added 13th and Johnson in 2024.
Effect of Road Diet with no bike lanes: How much will a road diet affect bicycle and pedestrian activity? Broadway is a four-lane corridor, the most dangerous lane configuration in Little Rock. Broadway is a state highway from Roosevelt to the Arkansas River, but ARDOT has agreed to turn over Broadway to the City of Little Rock between Roosevelt and 17th Street. The City of Little Rock will do a road diet on this section of Broadway. How will it affect people walking and biking along and across it? We added 24th and Broadway in 2024.
Sites Removed/Changed: We will not count the Levy Trail at 47th in 2024. We changed Markham and Monroe to Monroe and 6th.