


 Trash & Recycling
 Online Payments
 City Documents
 Parks
Parks
 Traffic Court
 E-NEWS
 EXPLORE
 NEWS
NEWS
Transportation Choice
The car is king in Little Rock. 72.6% of residents drive alone to work. In our metro area, our 38.9 per capita vehicle miles traveled/day is the highest out of 52 comparable cities (pg. 5).
But is that what residents want? The City of Little Rock recently compared how people commute in Little Rock (Fig. 1) to how they want to commute in Little Rock (Fig. 2). The differences were dramatic.
If people want to walk and bike for transportation, why don't they?
Learn more here.
Luckily, we don't have to guess. Metroplan did an extensive community outreach effort, using a variety of methods to engage a broad cross-section the public, to gauge our priorities. More recently, the City of Little Rock conducted a transportation survey asking how people commute and how people want to commute.
All outreach methods showed strong support for a bicycle- and pedestrian-friendly Little Rock, including Ideascale (Fig. 1), Community Conversations (pg. 20), website feedback (pg. 28), and whiteboards (pg. 30).
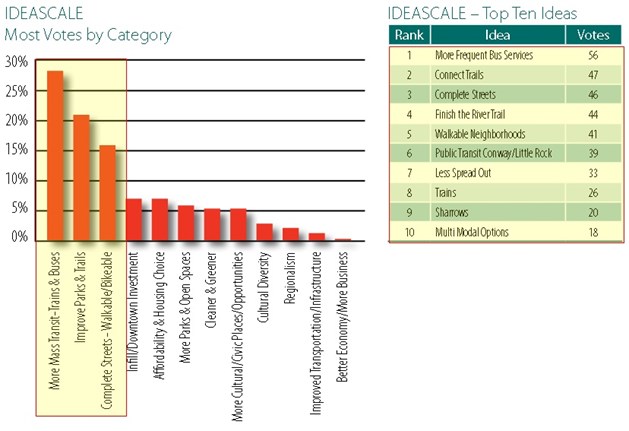
Figure 1. The Ideascale app allowed users to propose an answer to open-ended questions such as "I Imagine Central Arkansas..." and other users voted ideas up and down (pg. 7). In this system, the top three rated categories related to bicycle and pedestrian activity and all 10 top ten ideas related to car-optional transportation or a bicycle- and pedestrian-friendly community (pg. 28, see also 2019 BFCC Goals).
Based on this exhaustive community outreach, it is fair to say that people want a community and a transportation grid that supports walking and biking.
Latent Demand
A frequent argument against investment in bicycle and pedestrian infrastructure is that "no one bikes and walks in Little Rock". Thanks to the annual efforts of volunteer bicycle and pedestrian counters, we know that statement to be untrue. People do bike and walk in Little Rock, and bike commuting appears to be on the rise (Fig. 2).
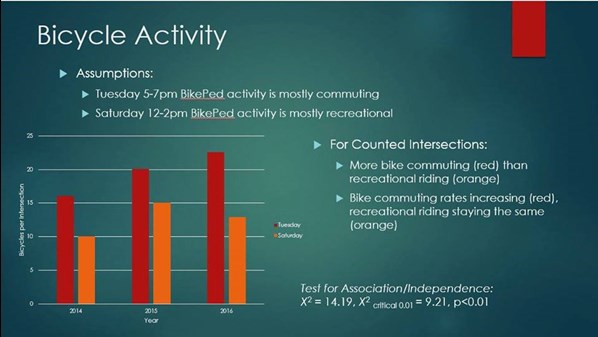
Figure 2. Data from our annual bicycle and pedestrian count, done in mid-September, show that people are biking (and walking - data not shown) and that bike commuting (red bars) may be increasing in Little Rock.
However, it's also true that Little Rock's bicycle commuting rate is low relative to other cities in the U.S. Why is that? The Metroplan community outreach data above provides some insight (i.e. our built environment does not support it) but a more recent community outreach effort goes farther. An ArDOT survey associated with Arkansas Bicycle and Pedestrian Transportation Plan asked Arkansans about their walking and biking patterns and what factors influence them. ArDOT generously provided the City of Little Rock those raw data, allowing us to consider the responses from Little Rock residents (Table 1).
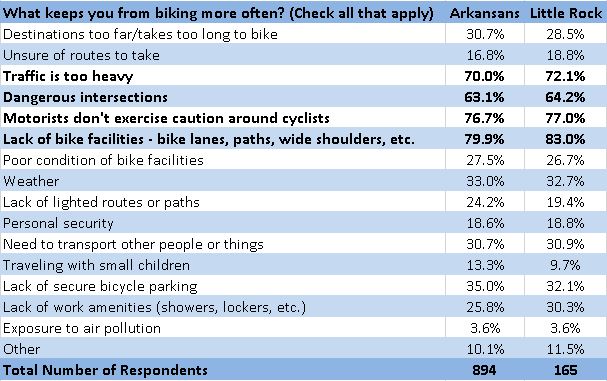
Table 1. The importance of various biking disincentives for Arkansans and Little Rock residents as a percentage of those who chose "High" when given the choices of High, Medium, or Low (modification of Arkansas Bicycle and Pedestrian Transportation Plan #25, pg. A-11).
So the four top answers, by far, have to do with a fear of being struck by a motor vehicle and the very top answer is a lack of bicycle facilities. Taken together, these outreach efforts show that Central Arkansans/Little Rock residents are very interested in walking and biking for recreation and transportation, but their built environment does not support it.
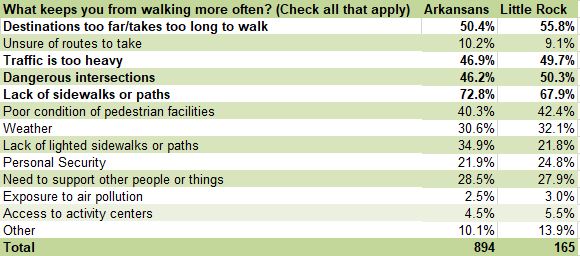
Table 2. The importance of various walking disincentives for Arkansans and Little Rock residents as a percentage of those who chose "High" when given the choices of High, Medium, or Low (modification of Arkansas Bicycle and Pedestrian Transportation Plan #25, pg. A-11).
Still More Evidence of the Fear Disincentive
Arkansas River Trail ?Loop?
The Arkansas River Trail's spatial use pattern for walkers and bikers shows that it is well-used when high-quality facilities exist and poorly used when facilities are absent or of low-quality (Fig. 3).
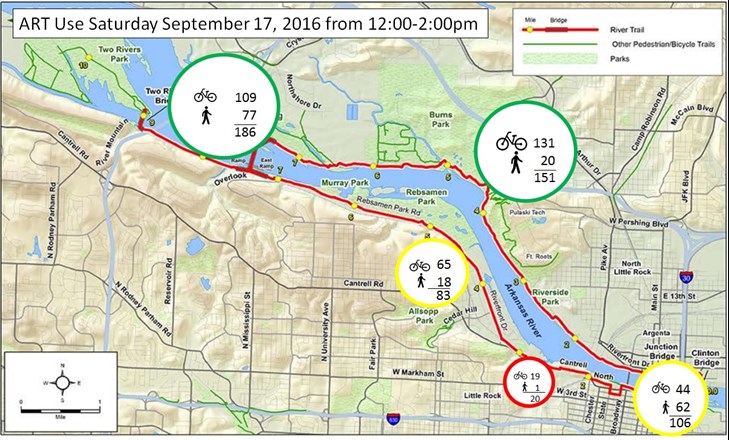
Figure 3. Little Rock residents and guests choose to walk and bike where our built facilities protect them from vehicular traffic and do not walk or bike nearly as much when those facilities are absent.
Pinnacle Valley Road
The City of Little Rock recently widened Pinnacle Valley Rd. and installed bike lanes as part of the Taylor Loop Connection. Anticipating this improvement, we included the intersection of Pinnacle Valley Rd. and Pinnacle Valley Ct. in the bicycle and pedestrian count starting in 2016, before bike lanes were installed. In 2016, no bicyclists or pedestrians were observed on either day of the count. This is not surprising given that there were no sidewalks and no bike lanes at that time. In 2017, bike lanes were installed but no sidewalks; 27 bikes were recorded (and no pedestrians). We built it and they came.
Quality Matters for Bike Facilities
Some bike facilities are better than others at attracting riders. Not surprisingly, the greater the separation between motor vehicles and bicycles a facility creates, the more the facility encourages ridership (Fig. 4). This is consistent with research conducted by Jennifer Dill and others demonstrating that higher-quality bike facilities (those facilities that better separate bike and vehicular traffic) attract a wider pool of riders (Fig. 5). The largest pool of riders (60% of the public!) are “Interested but Concerned”. If the goal is to increase ridership, it’s critically important to attract this large group (pg. 11). Ridership in this large group is strongly influenced by the quality of bike facilities (Fig. 6).
The level of separation required to make a bicycle corridor feel safe and encourage ridership depends on traffic volumes and speeds. Generally, when traffic volumes are larger and speeds are faster, more separation is required to encourage ridership (Fig. 7).
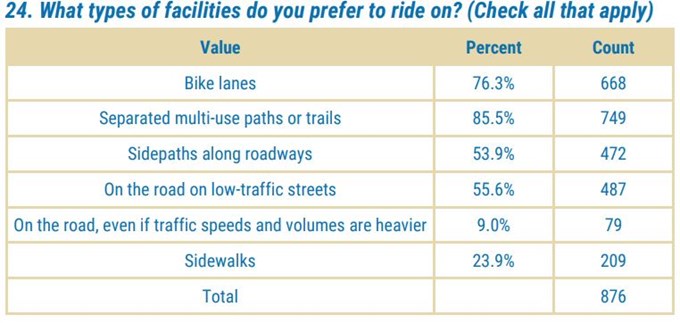
Figure 4. A bike facility that better separates the cyclist from the motorist is most effective at encouraging ridership for Arkansans (A-11).
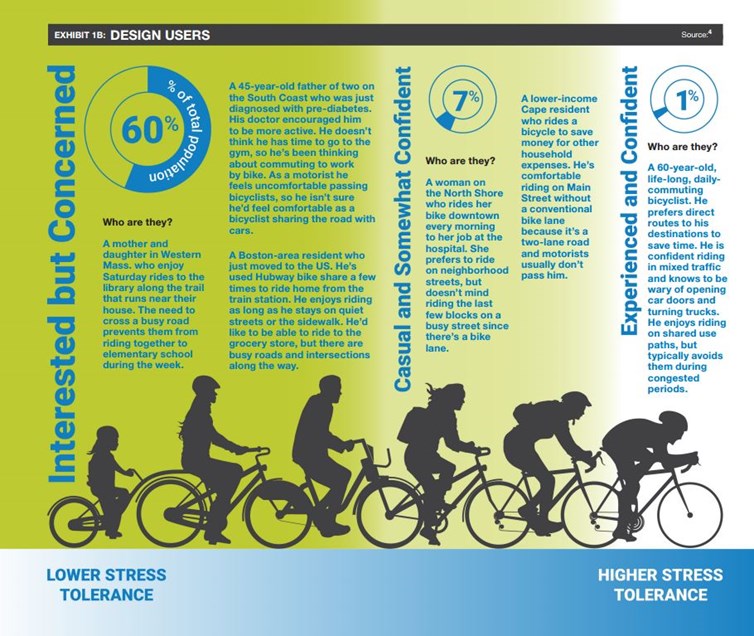
Figure 5. A small percentage of the population is willing to bike on a street with no separation from vehicular traffic, but a much larger percentage would bike if that separation existed (pg. 5).
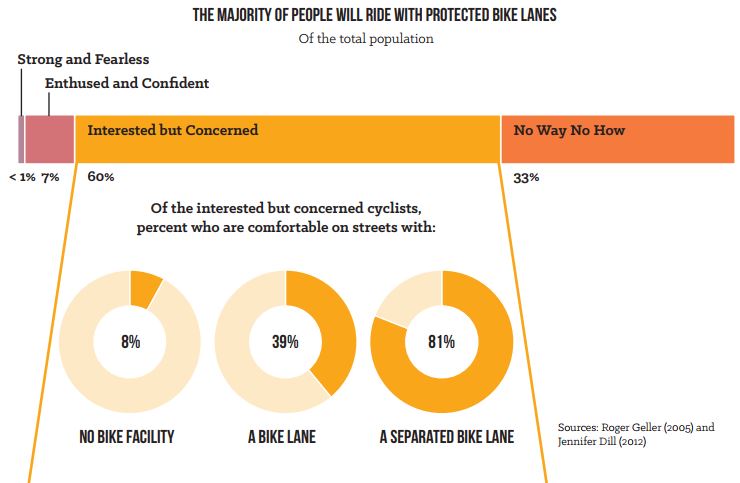
Figure 6. When potential bicycle riders are categorized by their stress tolerance, the largest pool of people fall into the "Interested but Concerned" category (Fig. 5). Designing facilities for this group maximizes the impact on ridership. Quality of the bike facility is critically important in its efficacy for this group and overall. A separated bike lane has a much greater impact on ridership than a standard bike lane Figure from NACTO report, pg. 6.
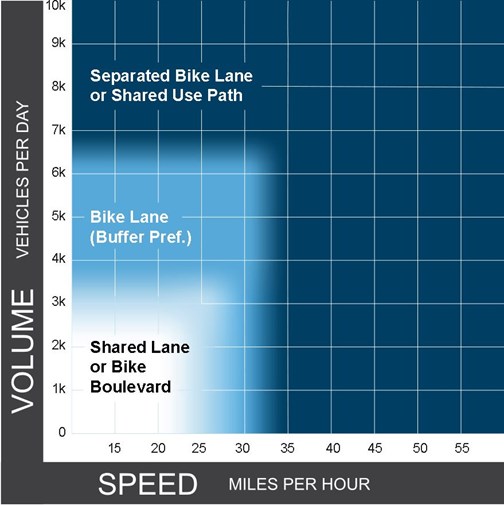
Figure 7. Recommended bike facility vs. vehicular traffic speed and volume, from the FHWA's Bikeway Selection Guide (2019).
If We Build It, Will They Come?
The evidence above shows that there is high demand for improved bicycle facilities and the absence of those facilities is the number one reason people do not bike and walk more in Little Rock. We also have data from other communities that saw dramatic increases in ridership after building bicycle networks. In a study of five U.S. cities, protected bike lanes increased ridership from 21%-171%. In Calgary, Canada, weekday bike trips increased 95% three months after a bike network was installed. New York City built 421 miles of bike lanes between 2007-2014 and bike traffic increased 100%.
The evidence is clear. Residents want a transportation system and recreational facilities that allow them to walk and bike. They are discouraged from walking and biking by a lack of these facilities. If we build these facilities, they will come.
