


 Trash & Recycling
 Online Payments
 City Documents
 Parks
Parks
 Traffic Court
 E-NEWS
 EXPLORE
 NEWS
NEWS
Why Should We Invest in Bicycle and Pedestrian Safety?
One answer can be found in the ArDOT video: one death is too many. Car vs. bike or ped collisions are relatively rare in the Little Rock metro area but account for 12% of our traffic fatalities. People on bikes and on foot are more affected by a collision with a car because of the relative masses (pg. 2) and the lack of protections of a modern motor vehicle (iron cage, crumple zones, seat belts, airbags, etc.).
Because People Walk, Bike, and Use Transit
But why not just design streets for cars (and thereby discourage walking and biking for transportation)? The simple answer is people walk, bike, and use transit on our streets and will continue to do so regardless of their design. Even when driving, road users will typically start or complete their trips as pedestrians. However, some residents are too young to drive but have no other way to get to school, home, or other destinations. Others have given up driving in their old age but can still maintain an independent lifestyle with other transportation modes. Still others may not be able to drive because of a medical condition. Many families cannot afford one or more automobiles and must use other transportation modes. Some residents choose active transportation because they don't have spare time for exercise, want to reduce their carbon footprints, or simply enjoy it. When streets are designed only for cars, they are inequitable, and that inequity disproportionately affects the safety of certain groups (Fig. 1).
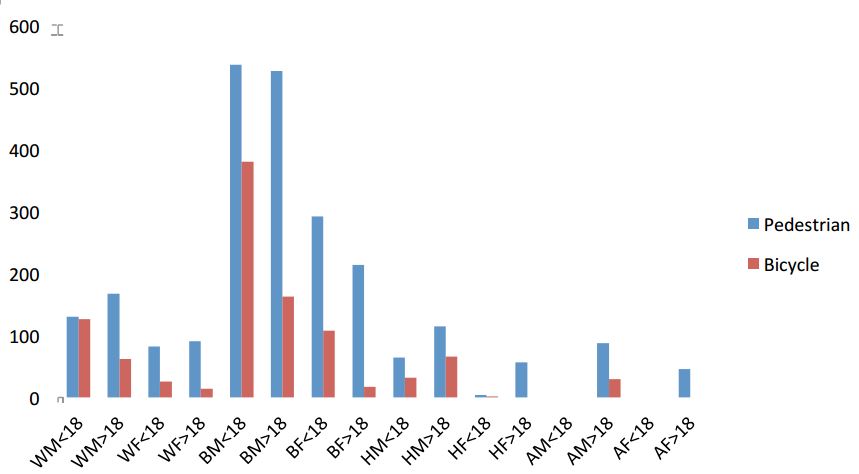
Figure 1. The number of pedestrian and bicycle crashes per 100,000 residents by race and age demographics in the Little Rock metro area (WM=white male, WF=white female, BM=black male, BF=black female, HM=Hispanic male, HF=Hispanic female, AM=Asian male, AF=Asian female; Fig. 8).
Because We Have a Pedestrian Safety Problem
Out of 52 CEOs for Cities communities, the Little Rock metro area was rated the 52nd most walkable (pg. 5). Smart Growth America rated the Little Rock metro area the 14th most dangerous metro area to walk in the country. When ArDOT asked Arkansans what keeps them from walking more, a lack of facilities/safety concerns were three of the four top answers. We need to consider how to increase safety for pedestrians on our streets (Fig. 2).
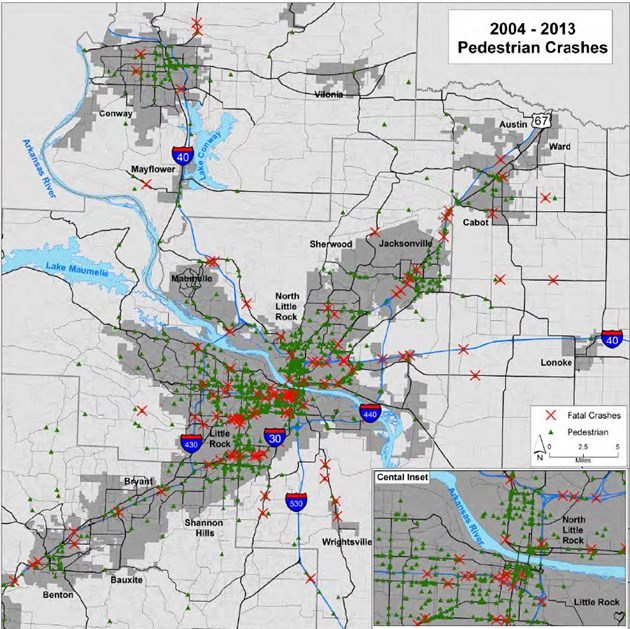
Figure 2. Locations of car vs. pedestrian non-fatal (green triangle) and fatal (red X) collisions from 2004-2013 (Fig. 1).
Because We Have a Bike Safety Problem
In Little Rock's most recent evaluation by the League of American Bicyclists, two of the three key outcomes they wanted to see were to increase safety for people on bikes. Their report showed Little Rock has 2.4 times as many car vs. bike crashes and 17.9 times as many bike fatalities as the average Silver-certified city. When ArDOT asked Arkansans what keeps them from walking more, a lack of facilities/safety concerns were the four top answers. We need to consider how to increase safety for people driving bikes on our streets (Fig. 3).
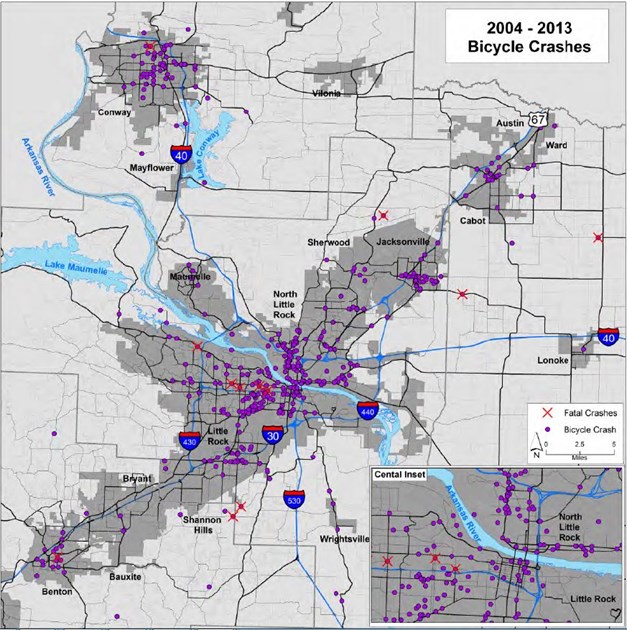
Figure 3. Locations of car vs. bike non-fatal (purple dot) and fatal (red X) collisions from 2004-2013 (Fig. 2).
Because Little Rock driving behavior is among the worst in the country
Little Rock ranks 158th out of 200 cities ranked for safe driving behavior in Allstate's annual city ranking. While this affects the safety of everyone on the street, it is particularly dangerous for people walking and biking because their lack of protection.
